
Health & Monitoring
Check readiness, product messaging, and monitoring in three steps; expand full commands and PromQL as needed.
Goal: check readiness on every node, then verify product behavior and monitoring separately.
1. Check readiness on every node
Use the actual API address from the management network or a protected loopback entry:
curl -sS -i http://127.0.0.1:5001/readyz| Result | Next action |
|---|---|
HTTP 200, ready: true | Use as a traffic-admission gate, then verify product messaging |
HTTP 503 | Hold traffic to this node; save the full response and reason |
| Connection failure | Check the entry and network through Troubleshooting |
/healthz proves only process liveness. During restore or maintenance it may succeed while /readyz fails; that does not permit restoring product traffic.
Complete liveness, readiness, and metrics checks
curl -sS -i http://127.0.0.1:5001/healthz
curl -sS -i http://127.0.0.1:5001/readyz
curl -sS http://127.0.0.1:5001/metrics
Replace 127.0.0.1:5001 with the node's real API address. The third endpoint may be unavailable when Prometheus metrics are disabled.
| Endpoint | Question it answers | Correct use |
|---|---|---|
/healthz | Is the WuKongIM process alive? | Process liveness checks and automatic restart |
/readyz | Can this node accept product traffic now? | Load balancing, rollout gates, and restoring traffic |
/metrics | How are errors, latency, queues, and resources changing? | Prometheus collection, dashboards, and alerts |
Remember one rule: a successful /healthz only means that the process is alive; only a successful /readyz means that the node can receive product traffic. A failed /readyz returns HTTP 503 and a reason. Save the complete response.
The process can be alive while the product is unavailable
During restore or other maintenance, /healthz, monitoring, and diagnostics may still work while /readyz remains failed. Do not restore product traffic just because the process is alive.
2. Check node state and product behavior
In Manager, inspect health, readiness, and data freshness. Then verify client connection, message sending, independent receipt, and history recovery.
Check: Inspect every node in a multi-node cluster. Preserve stale or conflicting state and pause changes. One readiness success does not verify messaging and recovery.
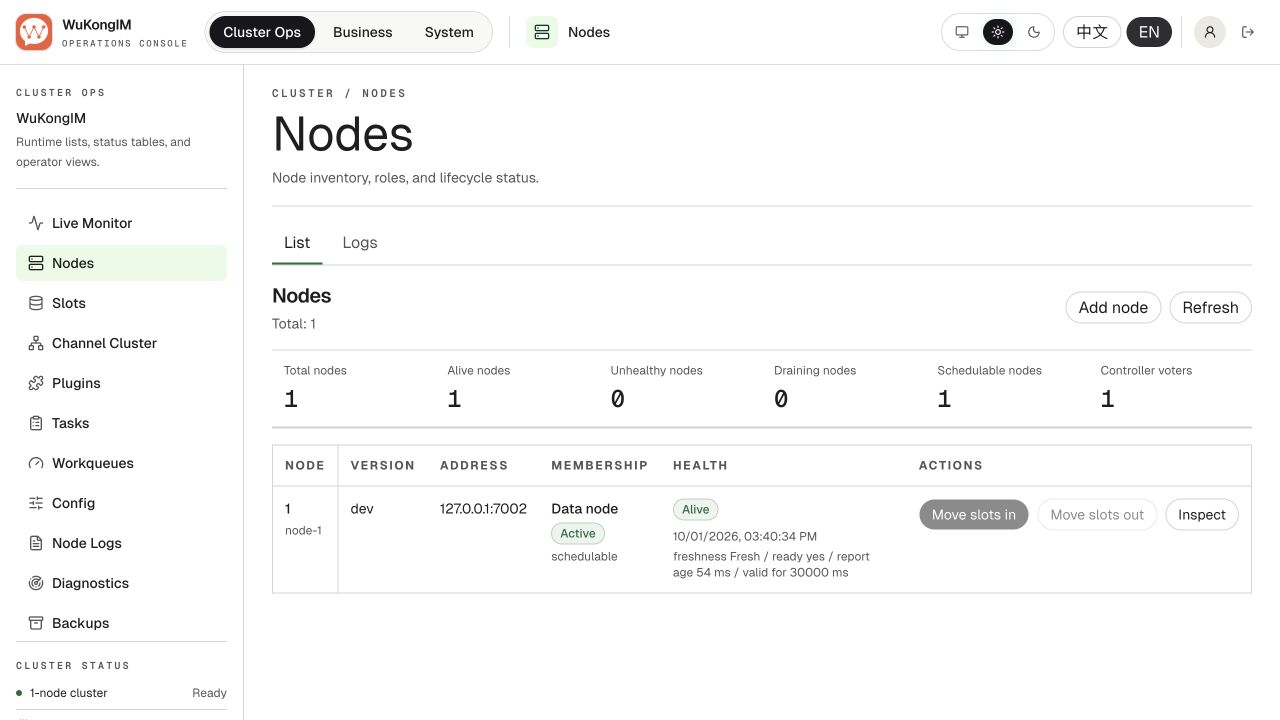
① Live-node count. ② Health, readiness, and data freshness. This reuses the recorded-version single-node cluster capture to show where to look; actual admission still checks /readyz per node. Click for the original.
3. Verify collection and alerts
Enable metrics, then have Prometheus scrape every node's /metrics. Check up{job="wukongim"}=1 before comparing trends, alerts, and logs over the same interval. Use your own job name and cluster label.
Successful collection does not prove readiness. An empty result may mean an unconfigured target, disabled metrics, or an event that has not occurred; do not treat it as a healthy zero.
Cover connections and errors, queues and delivery, cluster state, and machine resources. Compare per-node maximums and high percentiles; assign an alert responder.
Four monitoring groups: signals and problems
Start with these four groups. You do not need a complicated dashboard on day one.
| Group | Signals and problems |
|---|---|
| Traffic and connections | Watch: Connections, send errors, request rate, latency, reconnects Problem: Users cannot connect or messages become slow |
| Queues and delivery | Watch: Queue depth, rejection, drops, retries, webhook/plugin failures Problem: Messages back up or downstream delivery fails |
| Cluster state | Watch: Controller, Slot leaders, replicas, ISR, and tasks Problem: The process is running but cluster state is unhealthy |
| Machine resources | Watch: CPU, memory, goroutines, file descriptors, disk, and network Problem: Resource exhaustion makes the service unstable |
Manager Realtime and Top are useful for a quick view of one node. Prometheus shows trends over time. They complement one another, but neither replaces /readyz.
Prometheus: download, merge, and validate
Download prometheus.yml and alerts.yml into one directory. Replace the three private node endpoints, keep one target for a single-node cluster, and set a unique cluster label. Enable node metrics through Observability.
On the Prometheus host, validate the files before loading them through your existing service management process:
promtool check config prometheus.yml
promtool check rules alerts.yml
Confirm every target is UP in Prometheus Targets. For an existing configuration, merge only the relevant scrape_configs and rule_files; do not overwrite other jobs or scrape the same node twice. Configure notification receivers through your existing Prometheus/Alertmanager setup.
Four PromQL queries: labels, units, and interpretation
These queries use the sample's job="wukongim" and scrape-added cluster label; node_id comes from each node. Replace the selector if your job name differs. Check up{job="wukongim"} first: 0 means collection failed, while 1 only means a successful scrape, not successful /readyz. An empty result can mean an unconfigured target, disabled metrics, or an event that has not occurred; do not automatically interpret it as a healthy zero.
Connections: compare nodes
sum by (cluster, node_id) (wukongim_gateway_connections_active{job="wukongim"})The unit is connections, not distinct users. A skewed node suggests checking routing and connection distribution. For a sudden drop, compare gateway errors and client reconnects over the same interval.
Send failures: inspect reasons
sum by (cluster, node_id, reason) (increase(wukongim_gateway_sendacks_total{job="wukongim",reason!="success"}[5m]))Shows unsuccessful SENDACKs emitted in the last 5 minutes; it does not count all client timeouts. For auth_fail, check UID, device category, and token. For other reasons, consult Reason Code and the relevant node logs. Metric labels use names; protocol results use numeric codes.
Slow appends: inspect per-node P99
histogram_quantile(0.99,
  sum by (cluster, node_id, le) (
    rate(wukongim_message_append_duration_seconds_bucket{job="wukongim"}[5m])
  )
)
Values are seconds for server-side message append latency, not end-to-end receive latency. If P99 rises, compare disk IO, replication latency, and traffic on that node. Sparse traffic does not provide enough samples for a capacity conclusion.
Delivery backlog: inspect queued batches
max by (cluster, node_id) (wukongim_delivery_recipient_worker_queue_depth{job="wukongim"})The unit is queued delivery batches, not unread messages or undelivered users. For sustained growth, check delivery workers, downstream nodes, and connection writes before changing capacity.
The downloadable rules cover scrape failures, unsuccessful SENDACKs, and sustained delivery backlogs. The 2m, 10m, and 80% thresholds are starter examples to tune against your baseline; they do not cover all readiness, storage, or cluster failures.
Alerts: complete starter list and threshold principles
/readyzkeeps returning 503 or repeatedly changes state.- Send errors or latency keep rising.
- A queue keeps growing, or rejection, drops, or delivery failures appear.
- Disk space is low, or memory, file descriptors, or goroutines keep growing.
- Controller, Slot leader, replica, or ISR state is unhealthy.
- Monitoring collection stops, so cluster state becomes unknown.
Do not copy alert numbers from another environment. Observe the normal range for this version under a real product peak, then set thresholds. Large groups, high message rates, and many connections can create one-node or one-channel hot spots, so inspect maximums and high-percentile latency as well as averages.
What to do after an alert
Record time, impact, and the complete /readyz response. Align metrics, Manager, and logs; continue through Troubleshooting when needed.
Alerts must not automatically move leaders, delete nodes, or change topology. Settings are in Logs & Observability.